Bitcoin Bollinger Bands Tight Ahead of Expected Volatility
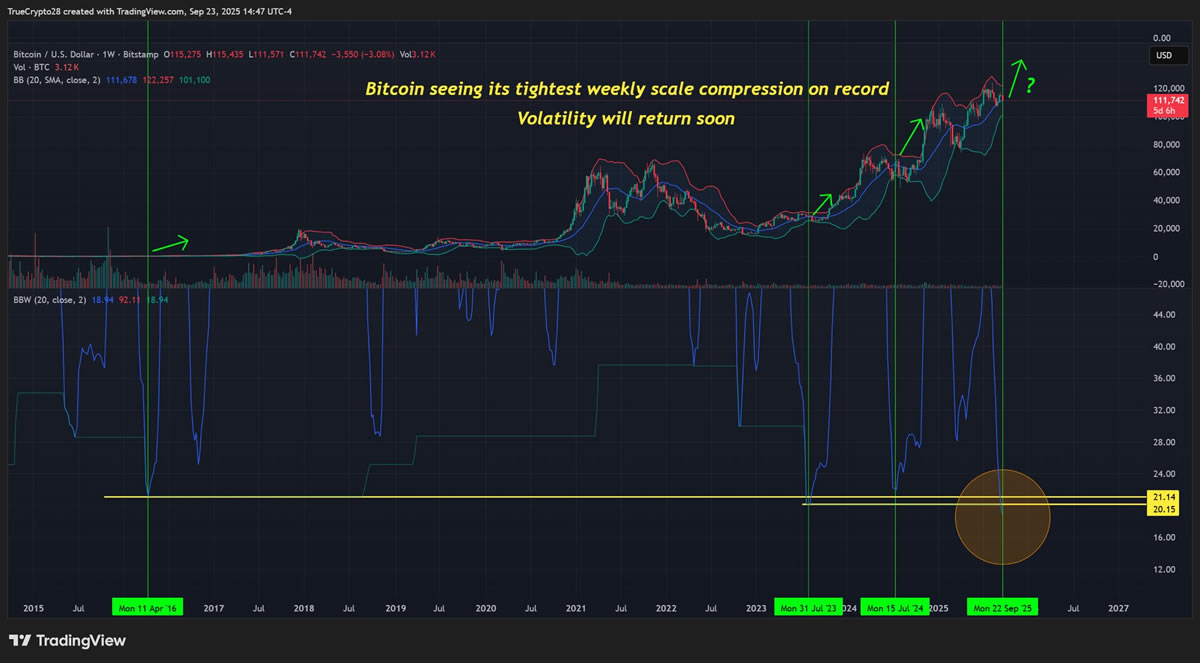
A key technical indicator for Bitcoin has squeezed to its tightest ever level amid low volatility, which analysts say usually precedes a large breakout and volatility spike.
“Bitcoin’s weekly Bollinger Bands are now the tightest in history,” the popular crypto analyst “Mr. Anderson” wrote to X on Tuesday, noting the technical indicator, which shows volatility and possible overbought or oversold positions.
“When volatility compresses this tightly, expansion always follows,” they said. “Once expansion starts, price almost always tests the outer bands rather quickly.”
Nassar Achkar, chief strategy officer at the CoinW exchange, told Cointelegraph that the Bollinger Bands’ tight compression “signals the calm before a significant volatility storm.”
“While a final September shakeout toward $100,000 is possible, the convergence of negative funding rates, strong seasonal trends, and institutional exchange-traded fund inflows tilts the odds heavily toward a bullish surge upward.”
“Compression this extreme rarely resolves quietly,” said Hunters of Web3 founder “Langerius.”

Bitcoin volatility declines over time
Glassnode researcher “CryptoVizArt” disagreed with the notion, stating that overall volatility has been in decline over all time frames because Bitcoin (BTC) has been growing larger over time; therefore, the Bollinger Bands have also been declining.
“This is not a signal, this is not an unexpected structure, this is simply an observation without any real predictive value,” they said.
Historical breakouts followed compression
Bitcoin Bollinger Bands were extremely tight in early July when the asset was trading around $108,000.
Days later, Bitcoin saw a surge in volatility and a significant upside breakout, propelling BTC to its first all-time high over $122,000 by July 14.
The technical indicator tightened up again in early September, reaching its most extreme level on the monthly time frame since BTC began trading.
Related: Bitcoin Bollinger Bands reach ‘most extreme level,’ hinting at explosion to $300K BTC
Septembear or Uptober move next?
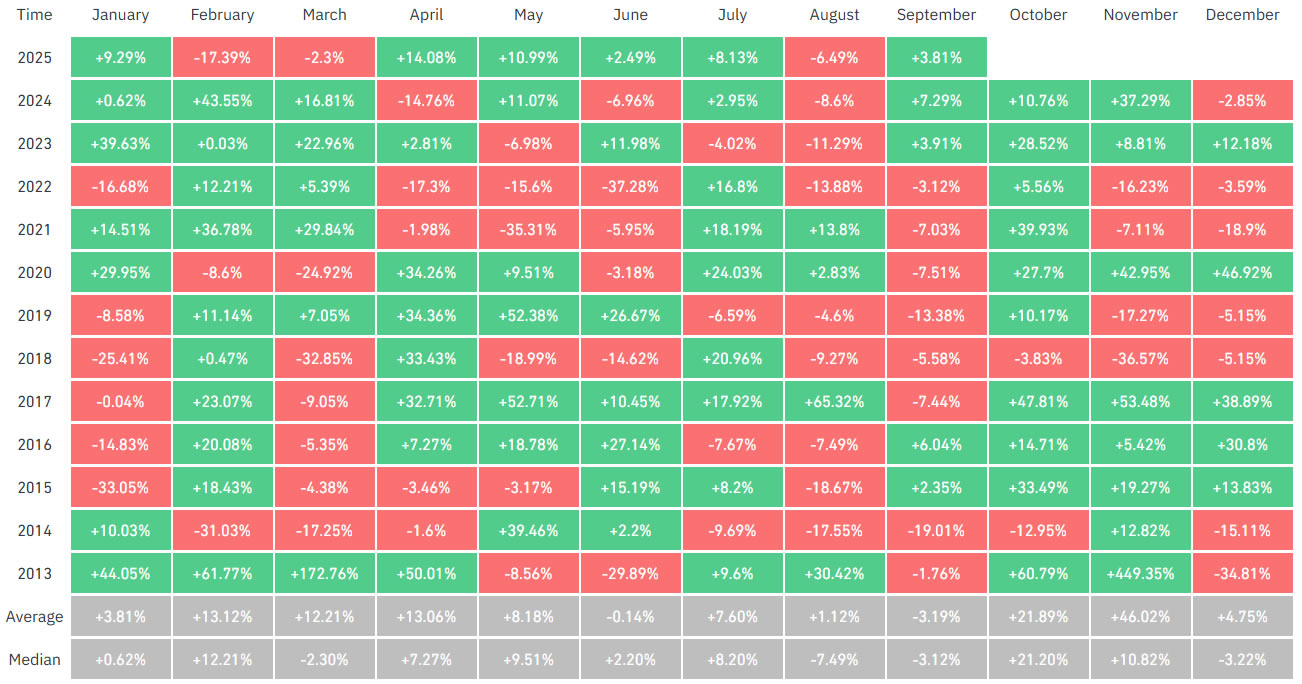
Analysts remain on the fence about which direction Bitcoin will next move as it enters October, which traders typically see as a major breakout month for Bitcoin, dubbed “Uptober.”
IG Group analyst Tony Sycamore told Cointelegraph on Tuesday that Bitcoin “needs more time to correct” and “continue to work off overbought readings” after its huge gains this year.
Meanwhile, many analysts have been sharing the CoinGlass historical performance chart, noting that Bitcoin has gained in 10 out of the past 12 Octobers and 8 out of the past 12 fourth quarters.

Magazine: Hayes tips ‘up only’ for crypto, ETH staking exit queue concerns: Hodler’s Digest


